Map: Subsidence in New Orleans
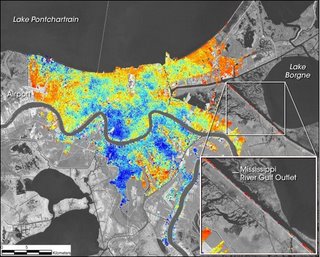
Between April 2002 and July 2005 ... researchers found that most of New Orleans subsided 8 millimeters per year relative to global mean sea level.
Red indicates the areas that sunk the most, up to 28.6 millimeters each year (just over an inch). Blue indicates the areas that sank the least. An inch a year may seem like a small change, but the researchers point out that the rate observed between 2002 and 2005 is probably at or near the slowest subsidence rate the area has experienced since the levees were first built in the 1960s: sinking probably occurred even faster just after the levees were first built. ... Many parts of the city were already meters below sea level in 2002. Historically, eastern New Orleans has seen the greatest subsidence in southern Louisiana. This part of the city was 3 to 5 meters below sea level when the hurricane struck and consequently saw some of the worst flooding.
NASA Earth Observatory, from Canada RADARSAT data.
Tags: Hurricane Katrina | Katrina | New Orleans | Louisiana | We Are Not OK | America's Wetland | America's Wetland | coastal restoration | Cat 5 storm protection | Levee | Flooding | Geographic Information Systems | Katrina GIS | Katrina map |
posted by Schroeder @ 10:39 AM
0 comments
![]()


0 Comments:
Post a Comment
<< Home